


Energy monitoring to make building smart and efficient
It is widely known that the building sector is responsible for 40% of global energy consumption. Commercial spaces like office, retail, healthcare, and schools are always on the forefront of consuming energy and hence it’s crucial for them to adopt strategies for energy saving and sustainability. The best step in managing your building’s energy is to understand how much you use and where you use it. From the previous blog, we have learned how the strategic process of leveraging data insights helps you to achieve energy-efficiency. By using energy management systems one can better monitor energy usage and optimize the performance of buildings. This article outlines how Lumos Controls comprehensive reports monitor and optimize your lighting network.
Energy reports explained
Reports help you remain up-to-date with four critical aspects
- Energy management
- Space utilization
- Device usage
- Emergency report.
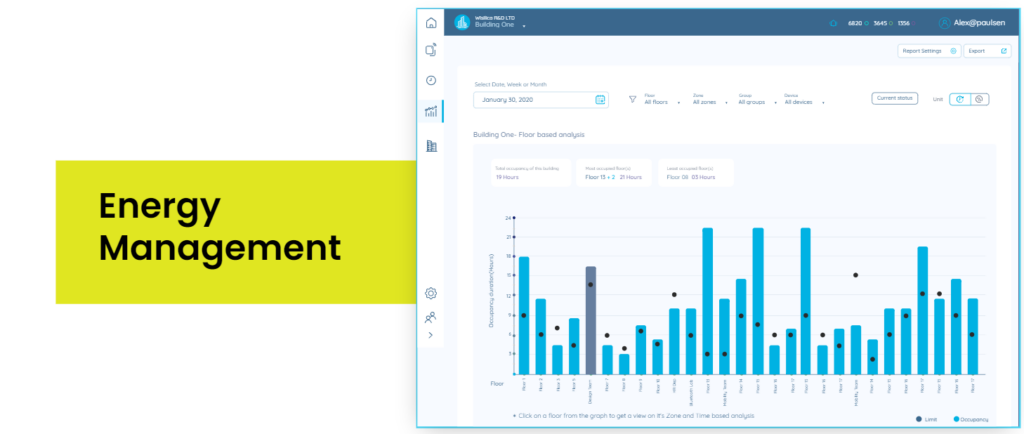
Energy management
Energy management reports calculate how much energy is used by lighting fixtures connected to Lumos Controls ecosystem. The energy consumption is estimated by taking into account the lighting fixture’s rated power, usage duration and prevailing utility rates. After the data has been collected, consumption patterns are displayed via trend reports while analytical reports showcase insights.
Trend reports
Trend reports enable you to understand the total energy consumed. It is the cumulative sum of usage value sent by the device at the configured interval which can be as low as 5 minutes. You could identify the energy consumption pattern of individual or group of devices, floor, zones on a daily, weekly or monthly basis. The generated data can be exported to CSV or PDF format.
Note: Daily trend reports show how power got consumed every hour of the day, while weekly and monthly reports are, by default, focused on showcasing daily trends across a particular week or month.
Analytical reports
Analytical reports showcase both predictive and descriptive calculations on the captured data. The captured consumption data is shown in kWh and respective utility bill. As in the trend reports, you would be able to identify which floor, zone, group, or device is consuming more energy. The system enables building managers to set energy consumption limits. When a certain entity’s consumption exceeds the set limit, visual notifications are displayed. Even if the consumption limits are not set, the system can use the past data to set energy limits to showcase the savings. The reports display the building’s total energy consumption, most energy-consuming floor(s) and its consumption, least energy-consuming floor(s) and its consumption, Savings (if any).
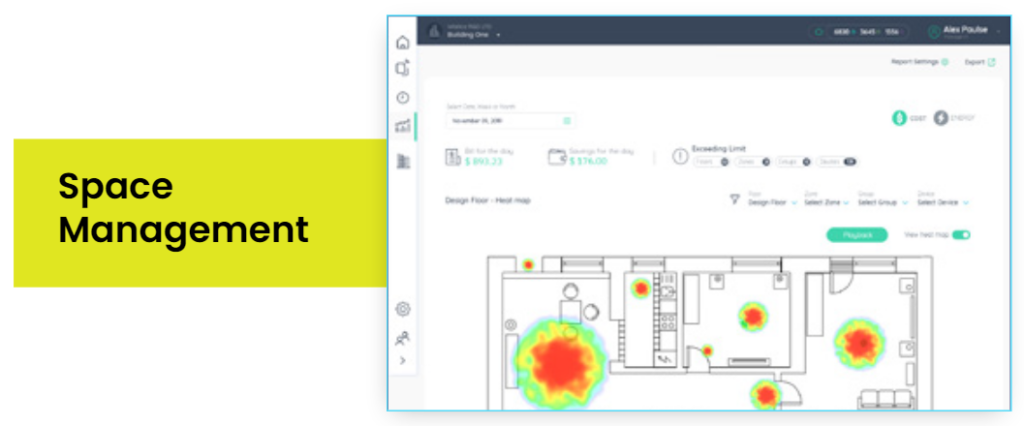
Space management
Space Management reports will give you a clear picture of the usage of a particular space. The reports display total hours for which the area was occupied or the percentage duration of the space occupation, depending on their configuration. After the data has been collected, occupancy duration patterns are displayed via trend reports while insights are shown via analytical reports. Also, inventory managers can use the space utilization report to check the utilization of an area and take the required action. The sensor sends the occupancy information at the configured advertising interval, which can be as low as 5 minutes.
The Trend reports display the occupancy duration and are calculated using occupancy data from a sensor. The sensor sends the occupancy information at the configured advertising interval, which can be as low as 5 minutes. You could identify the occupancy duration pattern of individual or group of devices, floor, zones on a daily, weekly or monthly basis. The Standard system retains the captured data for six months and could be exported in pdf or CSV format.
Building managers can configure occupancy duration limits, so visual alerts are showcased when occupancy in an entity crosses the set limit. Another addition to the analytical reports is the ability to compare the reports’ different entities. It allows operators to compare performance between other building parts via time-based and entity-based graphs.
Even if the occupancy limits are not set, the system can use the past data to set occupancy limit and use that for showcasing building’s total hours of occupancy, most occupied floor(s)and its duration of occupancy, least occupied floor(s), and its duration of occupancy.
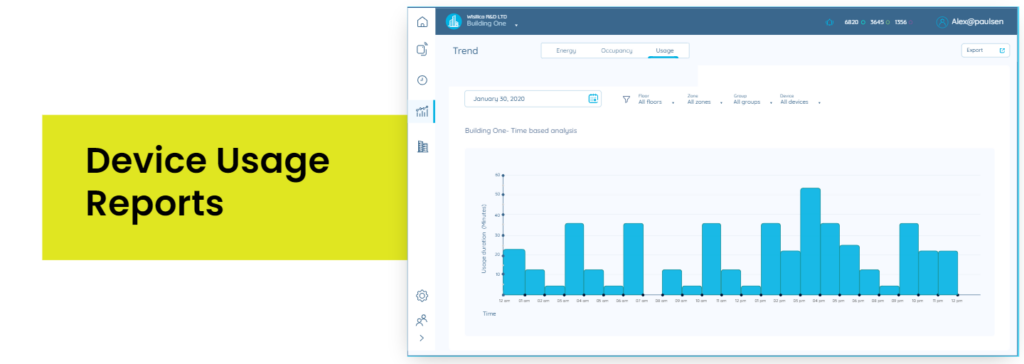
Device Management
Device usage reports let you understand fixtures’ usage and the time duration for which the devices were in use. The report provides information about the total hours or percentage of usage duration. Once the data is captured, device usage patterns are shown via Trend reports, while insights are shown via Analytical reports.
Trend reports display the device usage trend for a building, floor, zone, group, or individual device. The reports can be configured to showcase the device usage pattern on a daily, weekly, and monthly basis. The Lumos controls devices send the usage information at the configured advertising interval, as low as 5 minutes. This trend data would be available for a period of 6 months and could be exported out of the system in pdf or CSV format.
The system allows building managers to configure the limit of usage duration. Even if the limit is not configured, the system can use past data to calculate the usage limit to showcase device usage variations and comparisons. Analytical dashboard of device usage reports shows the building’s total hours of utilization, most utilized floor(s) and its duration of usage, least utilized floor(s), and its duration of usage.
Emergency Reports
Emergency devices should always stay up-to-date. Automated testing ensures the system is 100 percent healthy by constantly monitoring the system and then taking educated decisions. Occupant safety is ensured, and maintenance cost is reduced.
Note: Available only with our DALI lighting control system
Key advantages of Lumos Controls reports
- Understand when usage or energy consumption goes beyond set limits
- Calculate energy savings by comparing energy data with that of previous periods
- Export data to submit to authorities to comply with energy codes like Title 24
- Analyze usage patterns and make improvements
- Compare energy consumption data for different zones/floors and raise flags
- Plan layouts of facilities by identifying occupancy patterns of areas using occupancy heatmaps
Learn more about Lumos Controls emergency lighting here
Keep an eye on energy consumption
We hope you understand how our comprehensive web application reports provide vital insight into buildings’ energy usage.
Ready to optimize your building’s energy usage? Contact us, we are happy to help!